1. Fabrics#
| Short Description | Creating underlay connectivity and overlay control plane using the fabric resource |
| Estimated Time | 30 minutes |
| Topology Nodes | spine1, spine2, leaf1, leaf2, leaf3, borderleaf1, borderleaf2 |
1.1 Objective#
In this exercise, we enable IP connectivity between the switches in our lab topology. This underlay network is the basis of our fabric. It provides connectivity and allows EVPN routes to be exchanged to build services.
1.2 Technology explanation#
Typically in a Data Center Fabric network, BGP is used as the de-facto routing protocol. The control plane is split into two functions, the underlay and the overlay network.
1.2.1 Underlay Network#
The underlay network provides IP connectivity between the data center's servers and routers. Typically, eBGP is being used as routing protocol for its dependability and scalability.
1.2.2 Overlay Network#
An overlay network is established using tunneling techniques to carry traffic over the underlay network. This makes an overlay network logically separate and independent from the addressing and protocols used in the underlay network. It also keeps the overlay networks logically separate from each other. Workloads that are connected to the same overlay network can send Ethernet or IP packets to each other, but not to workloads in other overlay networks. Typically, iBGP is used to distribute reachability information for the workload endpoints.
1.2.3 Building Fabrics using EDA#
We will need to establish eBGP sessions between leafs and spines, and a full mesh of iBGP sessions to setup the underlay and overlay networks in our fabric. EDA will abstract the concept of a "fabric" and translate the user's input into node configuration.
When building a fabric, you need to be weary of many different things, ISL IP addresses, ASNs, routing policies, loopback IP addresses, etc. EDA will automatically allocate these parameters from a pool. However, if you want more control over these choices, this is still possible.
EDA is built on apps, the Fabrics app allows you to create a fabric, which on its turn will create multiple resources in other apps, which in its turn are translated into node configuration. 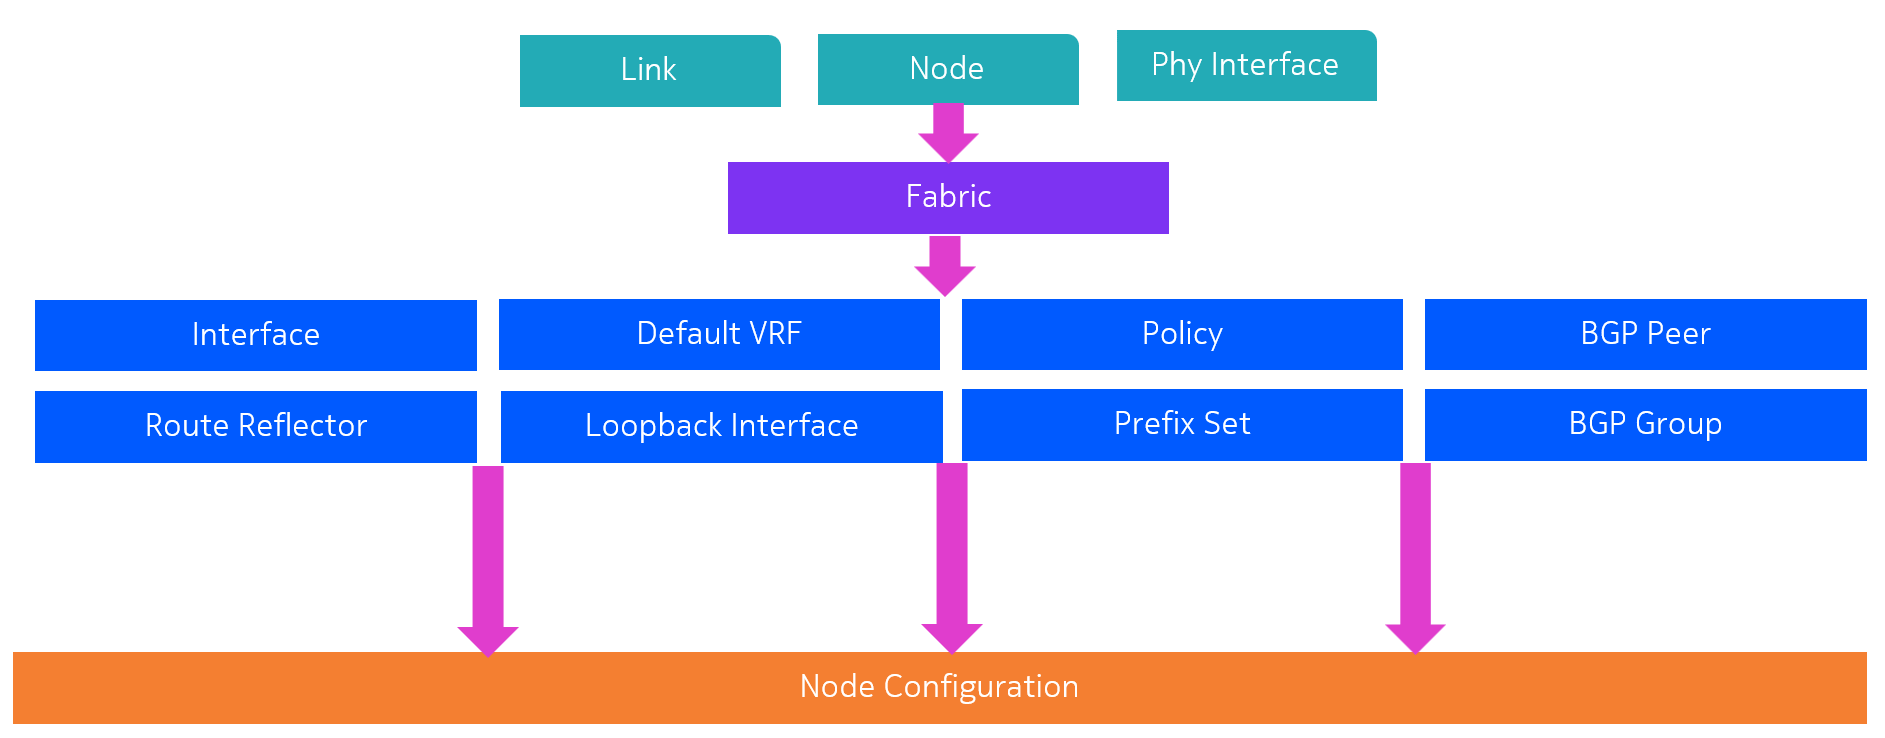
1.3 Tasks#
Remove existing fabric
Before continuing to this activity, make sure you remove the already existing fabric resource. This was set in place to run the other activities smoothly.
To remove, navigate to the Fabrics resource, and delete the srexperts-fabric resource. 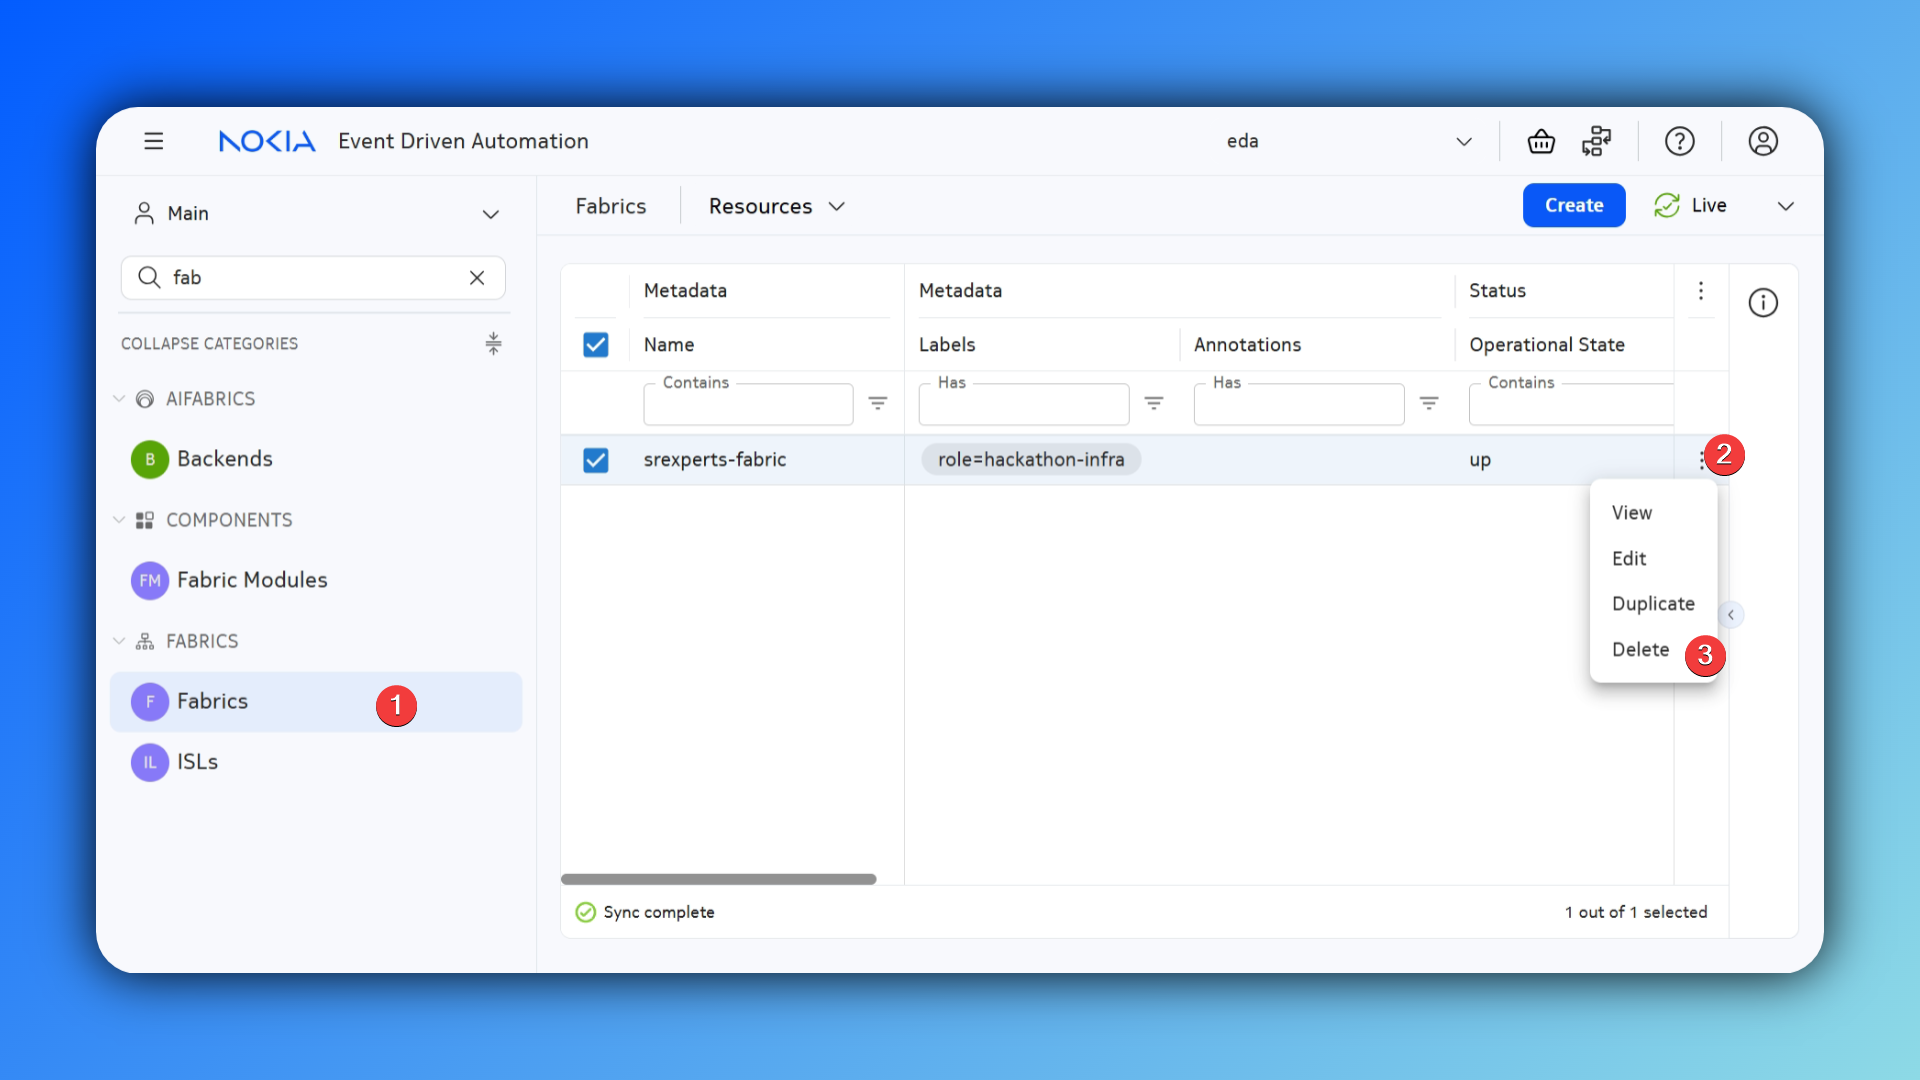
1.3.1 Validate that no IP connectivity is present#
In SR Linux, the underlay routing protocol is specified in the default network-instance. Therefore, the absolute minimum configuration required to build a fabric, is the default network-instance.
Login into one of the nodes and verify whether the default network-instance is configured.
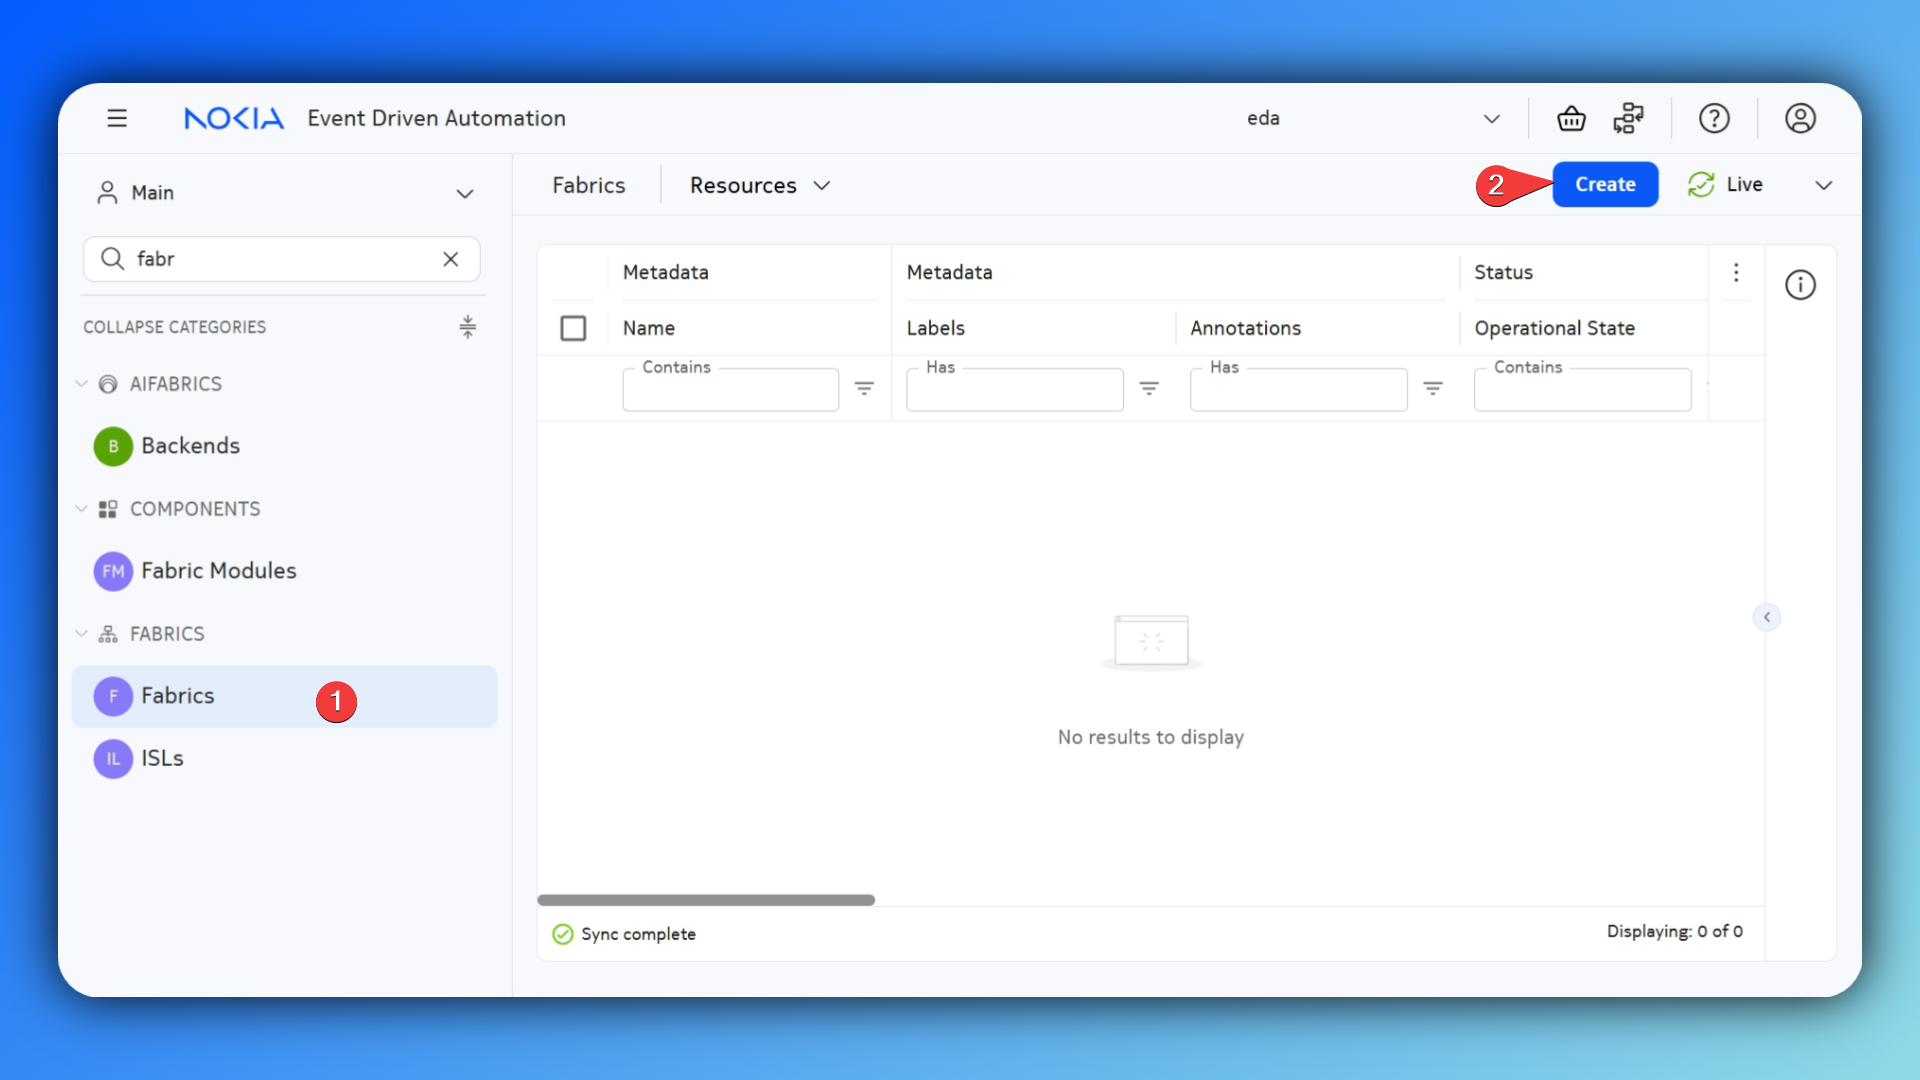
1.3.2 Create a Fabric#
Navigate to the fabrics app and create a new fabric resource.
Go through the form and build your fabric.
Hint
Make sure, when filling out the form, that you are using the appropriate labels to build your fabric resource efficiently.
Hint
When selecting your inter-switch links (ISLs), you can allocate them to an address pool, or skip this entirely by using IPv6 unnumbered interfaces. This also saves you some IP addressing space.
Solution
It might be tricky to solve this challenge if you see EDA for the first time, so here is a solution:
apiVersion: fabrics.eda.nokia.com/v1alpha1
kind: Fabric
metadata:
  name: my-fabric
  namespace: eda
spec:
  borderLeafs:
    borderLeafNodeSelector:
      - eda.nokia.com/role=borderleaf
  interSwitchLinks:
    linkSelector:
      - eda.nokia.com/role=interSwitch
    unnumbered: IPV6
  leafs:
    leafNodeSelector:
      - eda.nokia.com/role=leaf
  overlayProtocol:
    bfd:
      enabled: true
    bgp:
      autonomousSystem: 65000
      clusterID: '1'
      rrClientNodeSelector:
        - eda.nokia.com/role=leaf
        - eda.nokia.com/role=borderleaf
      rrNodeSelector:
        - eda.nokia.com/role=spine
    protocol: IBGP
  spines:
    spineNodeSelector:
      - eda.nokia.com/role=spine
  systemPoolIPV4: systemipv4-pool
  underlayProtocol:
    bfd:
      enabled: true
    bgp:
      asnPool: asn-pool
    protocol:
      - EBGP
Other fabric types
You may have noticed that eBGP underlay / iBGP overlay is not the only option in our fabric abstraction. EDA allows you to build fabrics using eBGP, OSPFv2 and OSPFv3 on the underlay, and iBGP or eBGP on the overlay.
example: OSPFv2 underlay, iBGP overlay
apiVersion: fabrics.eda.nokia.com/v1alpha1
kind: Fabric
metadata:
  name: my-fabric
  namespace: eda
spec:
  borderLeafs:
    borderLeafNodeSelector:
      - eda.nokia.com/role = borderleaf
  interSwitchLinks:
    linkSelector:
      - eda.nokia.com/role = interSwitch
    poolIPV4: ipv4-pool
  leafs:
    leafNodeSelector:
      - eda.nokia.com/role = leaf
  overlayProtocol:
    bfd:
      desiredMinTransmitInt: 1000000
      detectionMultiplier: 3
      enabled: true
      minEchoReceiveInterval: 1000000
      requiredMinReceive: 1000000
    bgp:
      autonomousSystem: 65000
      clusterID: '1'
      rrClientNodeSelector:
        - eda.nokia.com/role=leaf
        - eda.nokia.com/role=borderleaf
      rrNodeSelector:
        - eda.nokia.com/role=spine
    protocol: IBGP
  spines:
    spineNodeSelector:
      - eda.nokia.com/role = spine
  systemPoolIPV4: systemipv4-pool
  underlayProtocol:
    bfd:
      enabled: true
    protocol:
      - OSPFv2
example: eBGP underlay, eBGP overlay
apiVersion: fabrics.eda.nokia.com/v1alpha1
kind: Fabric
metadata:
  name: my-fabric
  namespace: eda
spec:
  borderLeafs:
    borderLeafNodeSelector:
      - eda.nokia.com/role = borderleaf
  interSwitchLinks:
    linkSelector:
      - eda.nokia.com/role = interSwitch
    unnumbered: IPV6
  leafs:
    leafNodeSelector:
      - eda.nokia.com/role = leaf
  overlayProtocol:
    bgp: {}
    protocol: EBGP
  spines:
    spineNodeSelector:
      - eda.nokia.com/role = spine
  systemPoolIPV4: systemipv4-pool
  underlayProtocol:
    bfd:
      enabled: true
    protocol:
      - EBGP
    bgp:
      asnPool: asn-pool
1.3.3 Validate underlay connectivity#
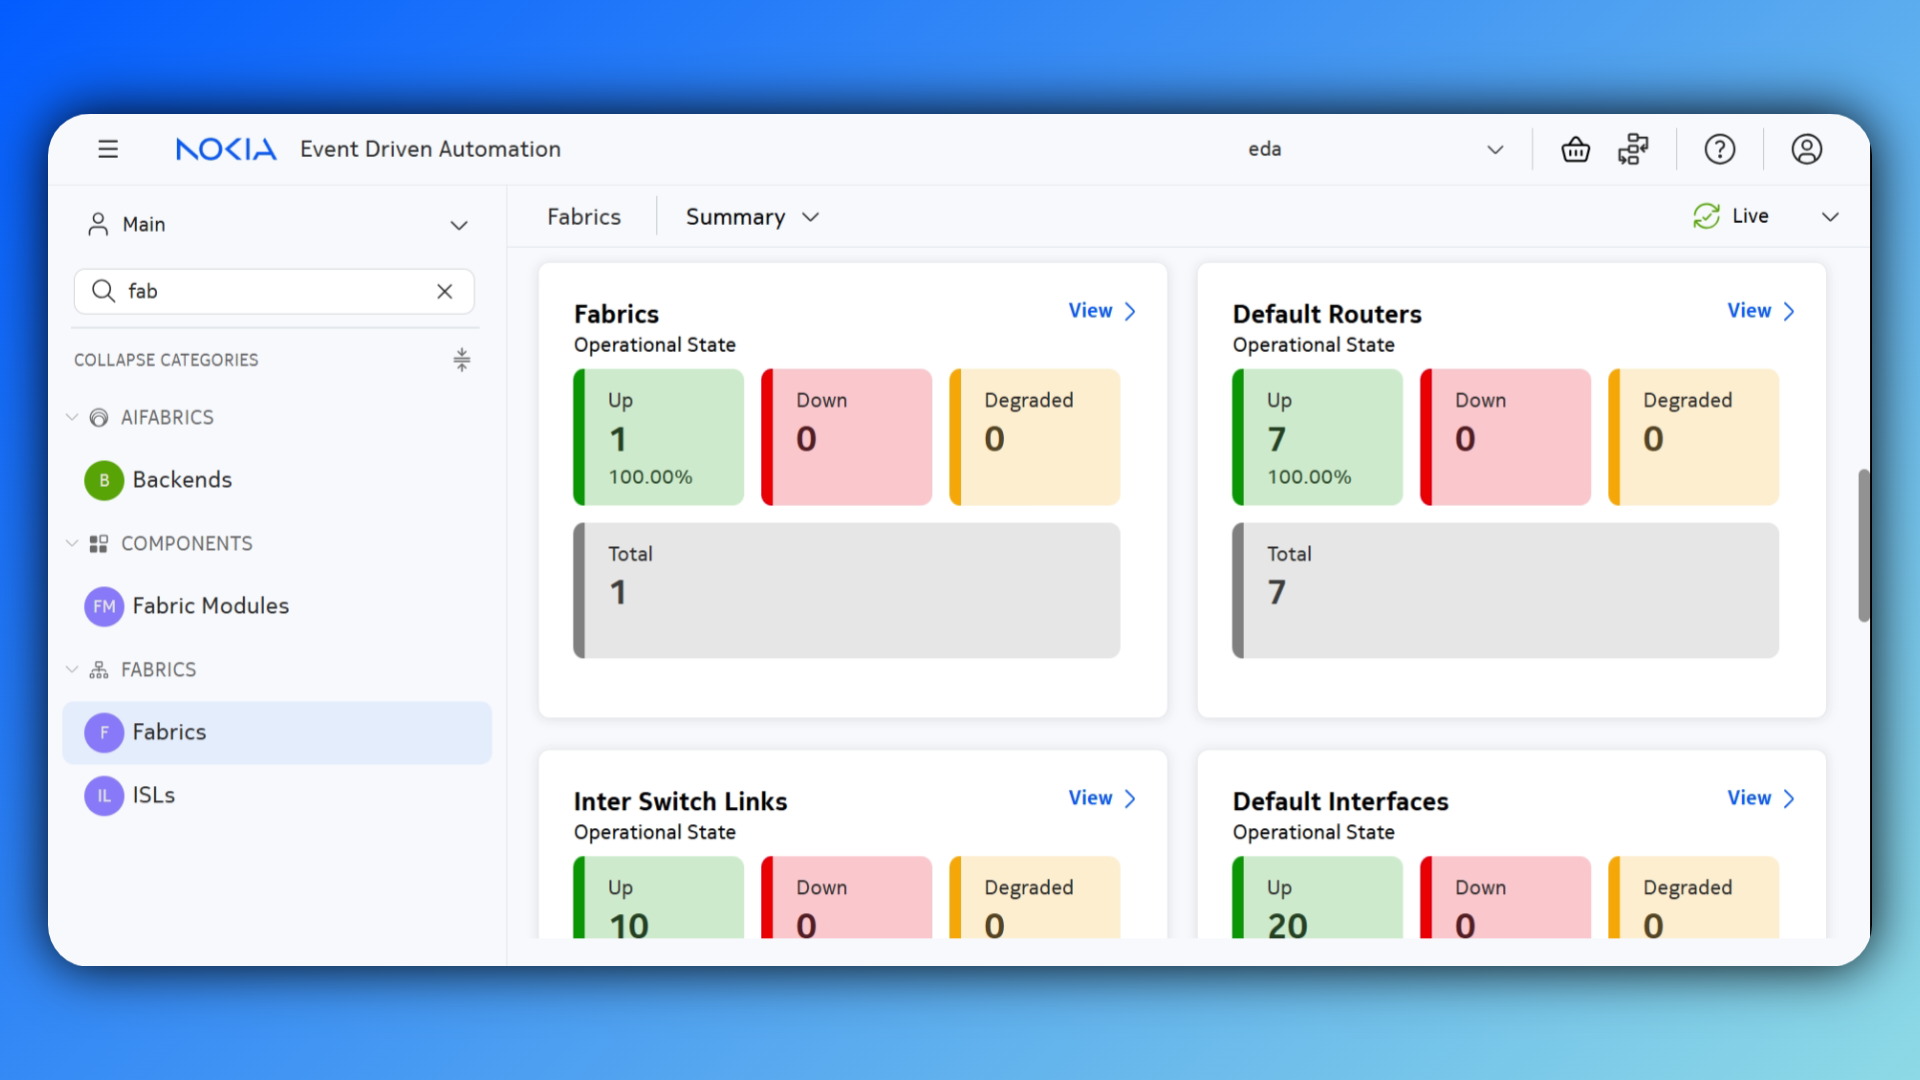
1.3.3.1 Fabric summary dashboard#
Most EDA applications are shipped with their dedicated dashboards. This way you can monitor your network's health in the blink of an eye.
1.3.3.2 Using EDA Workflows#
EDA comes with a set of operational automation tools, defined in Workflows. In this scenario, we can use the Check BGP workflow to validate the default BGP peers and the Ping workflow to ping one of the system loopback addresses from all nodes to validate the underlay routing.
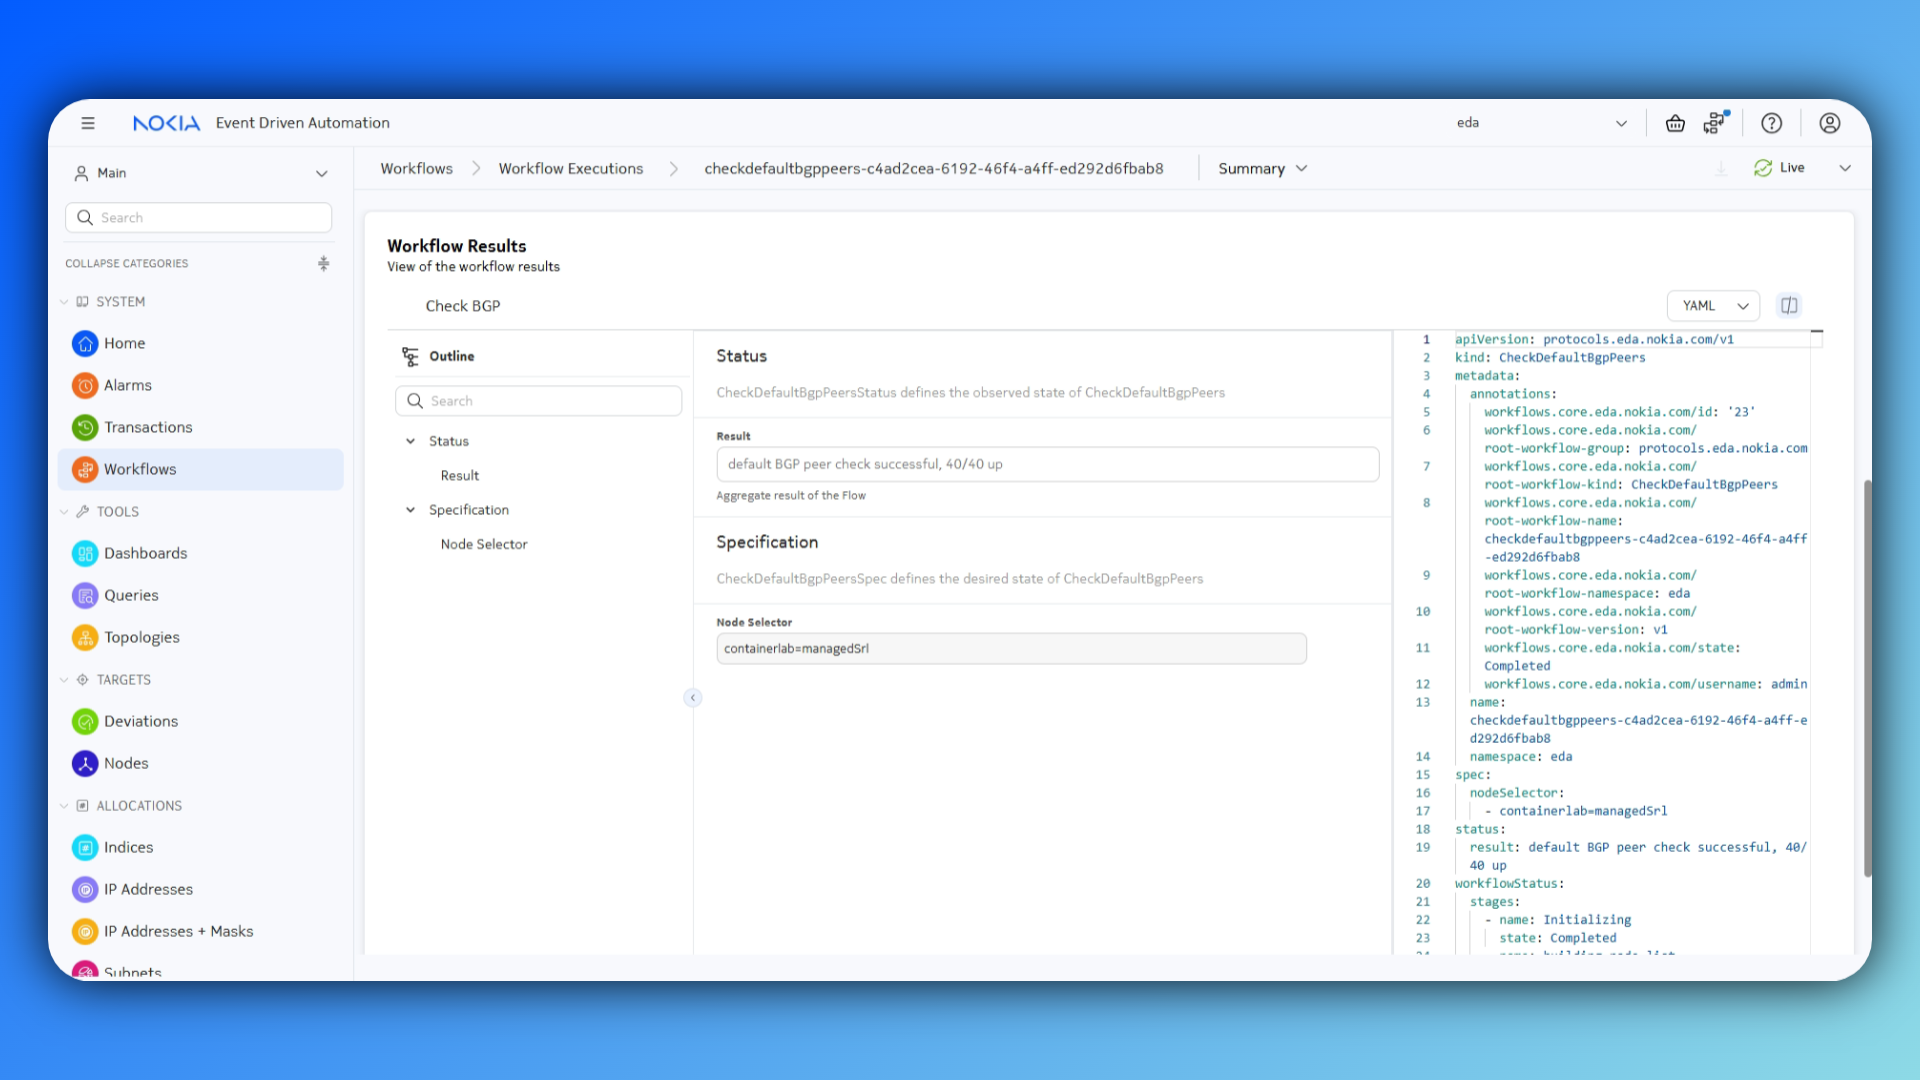
1.3.3.2.1 Check BGP#
The only input required for the Check BGP workflow is the target node. Use a common label for all nodes to easily select all nodes in your topology in one go.
Check BGP Solution
1.3.3.2.2 Ping#
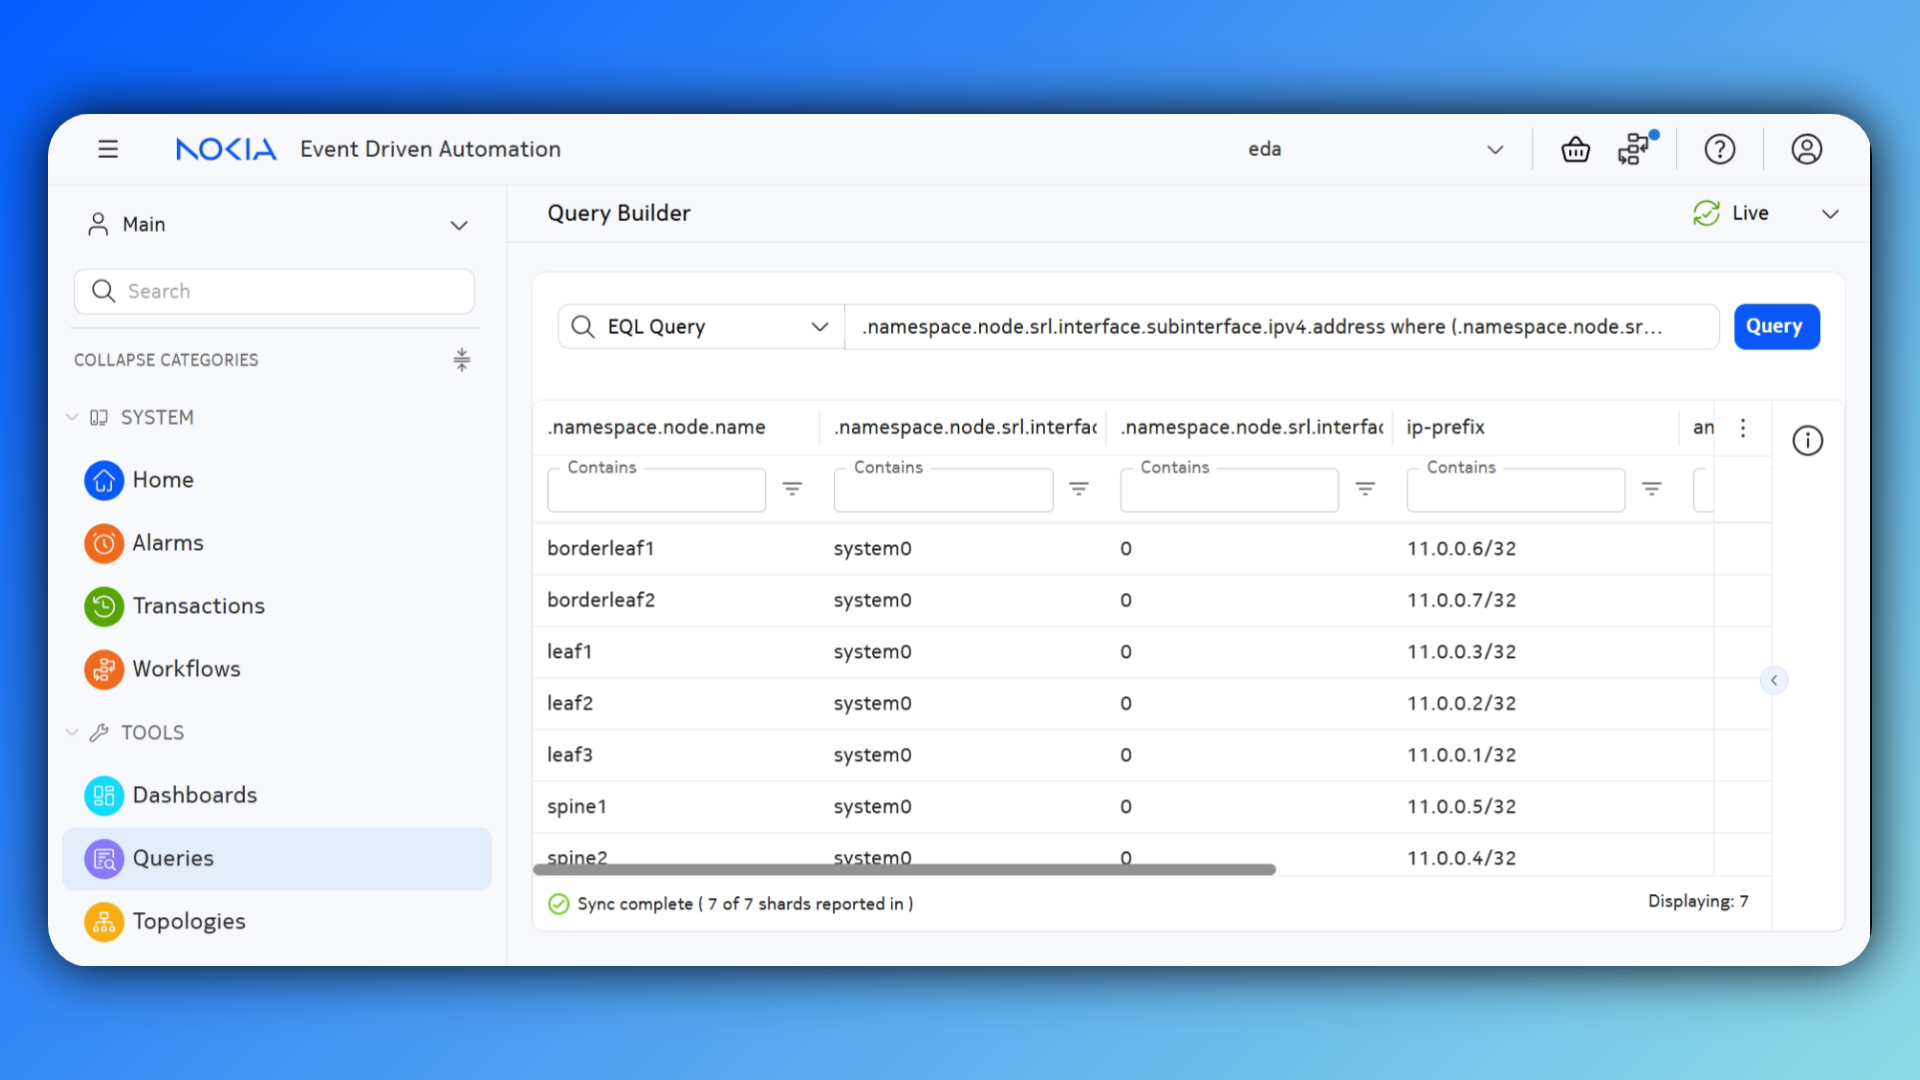
Identify the system loopback IP address using EQL. One of these addresses will serve as an input in the Ping workflow.
EQL solution
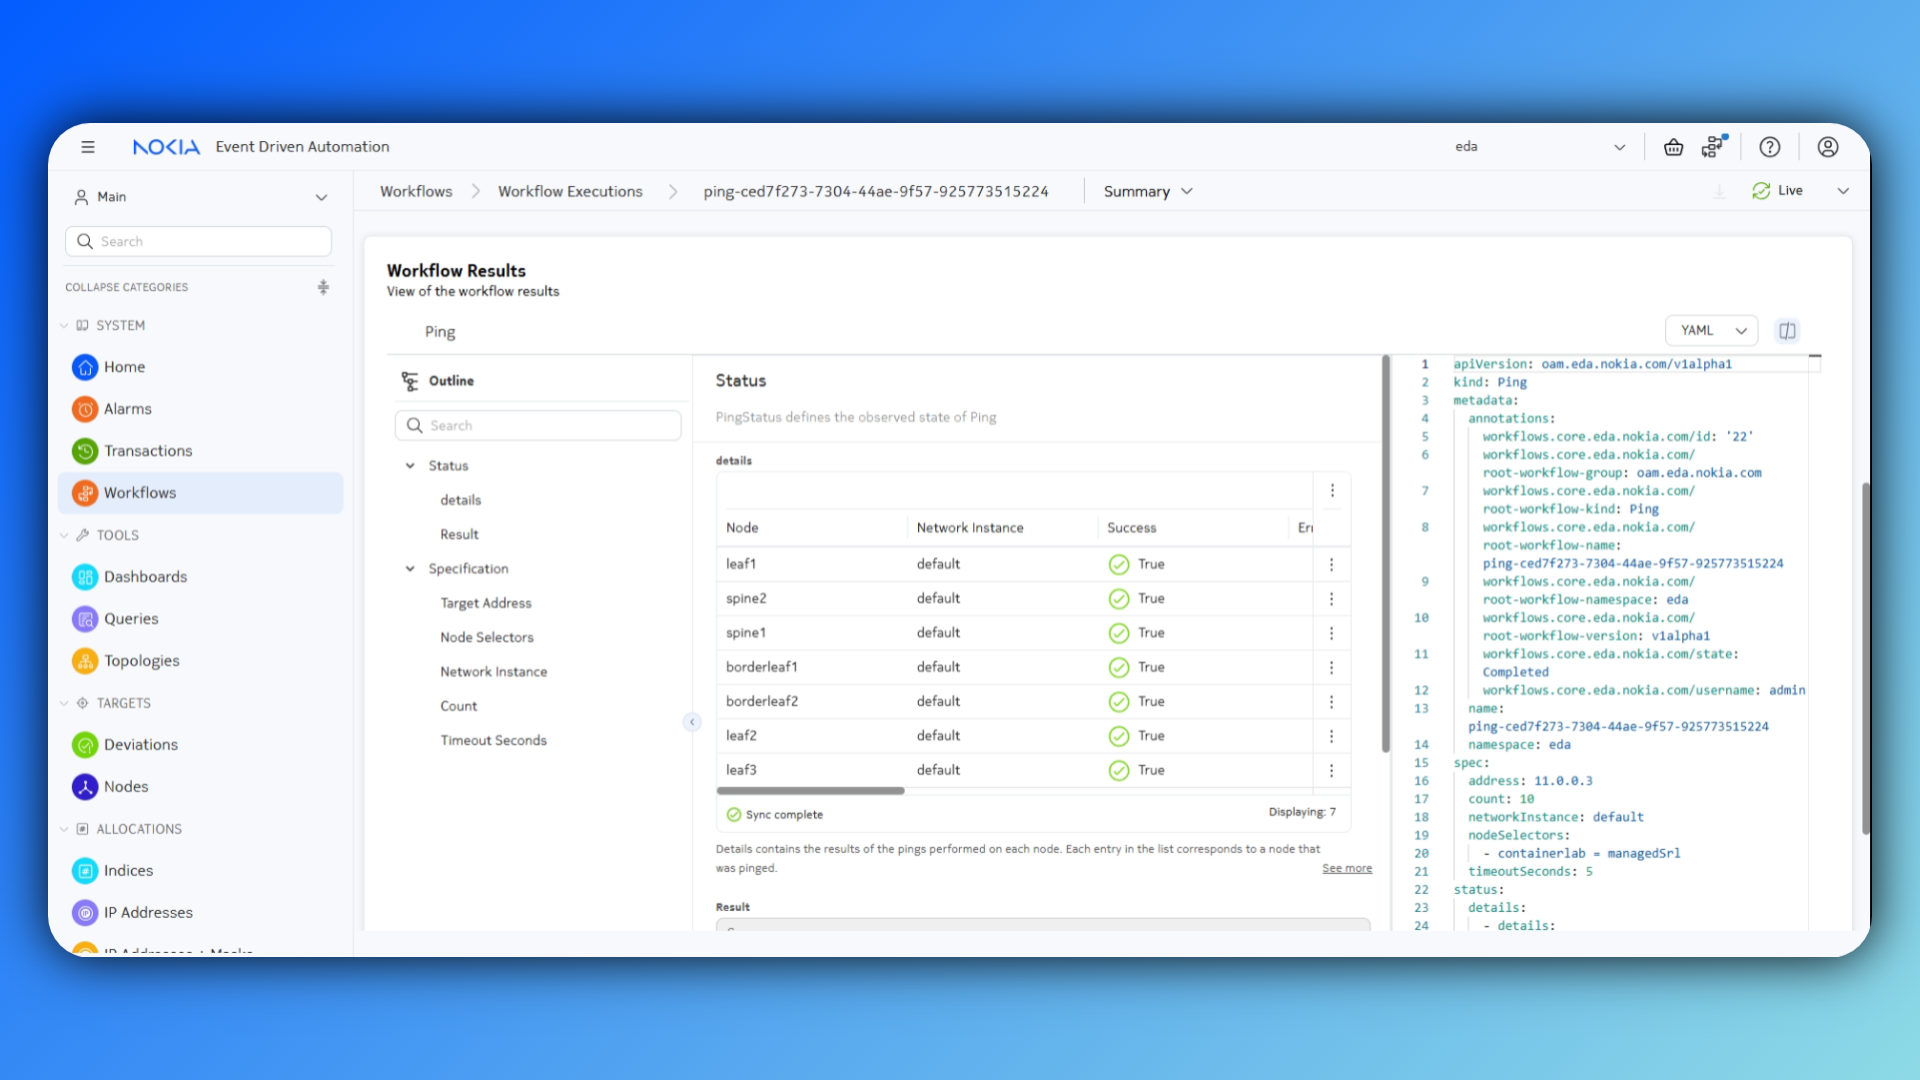
Workflow solution
This Ping workflow will ping the system0 loopback interface on leaf-1 from all nodes.
In the Workflow Results, you can inspect the ping details and statistics.
1.3.3.3 SR Linux CLI#
EDA offers great observability features, but sometimes it can still be useful to use the CLI to assess the network's health.
1.3.3.3.1 Configuration inspection#
Log into one of the nodes and inspect the running configuration using the info <YANG PATH> command.
    network-instance default {
        !!! EDA Source CRs: fabrics.eda.nokia.com/v1alpha1/Fabric/my-fabric
        type default !!! EDA Source CRs: fabrics.eda.nokia.com/v1alpha1/Fabric/my-fabric
        admin-state enable !!! EDA Source CRs: fabrics.eda.nokia.com/v1alpha1/Fabric/my-fabric
        description "fabric: my-fabric role: leaf" !!! EDA Source CRs: fabrics.eda.nokia.com/v1alpha1/Fabric/my-fabric
        router-id 11.0.0.3 !!! EDA Source CRs: fabrics.eda.nokia.com/v1alpha1/Fabric/my-fabric
        ip-forwarding {
            !!! EDA Source CRs: fabrics.eda.nokia.com/v1alpha1/Fabric/my-fabric
            receive-ipv4-check false
        }
        interface ethernet-1/31.0 {
            !!! EDA Source CRs: fabrics.eda.nokia.com/v1alpha1/Fabric/my-fabric
    # clipped
Transaction details
Alternatively, you can also inspect the changes in EDA, by looking at the transaction details. This view will show all resources that were created when running your intent. Next to this, the actual translation to node config is also shown here.
1.3.3.3.2 State information#
With SR Linux' CLI you can easily fetch state information from your node using the info from state <YANG PATH> command. For example:
EDA Query Language
Alternatively, you can also monitor the full network state in EDA using queries. The full YANG tree of state information is populated into the EDA state database as well. You can use EQL to query this database. The above example would equate to .namespace.node.srl.network-instance fields [ oper-state ] where (name = "default") in EQL.
1.3.3.3.3 Show commands#
Instead of directly inspecting the raw state information, you can also use show commands in SR Linux. These present state information in a more human readable format.
-----------------------------------------------------------------------------------------------------------------------
BGP neighbor summary for network-instance "default"
Flags: S static, D dynamic, L discovered by LLDP, B BFD enabled, - disabled, * slow
-----------------------------------------------------------------------------------------------------------------------
-----------------------------------------------------------------------------------------------------------------------
+-------------+-------------------+-------------+-----+-------+-----------+-----------+----------+-------------------+
|  Net-Inst   |       Peer        |    Group    | Fla | Peer- |   State   |  Uptime   | AFI/SAFI |  [Rx/Active/Tx]   |
|             |                   |             | gs  |  AS   |           |           |          |                   |
+=============+===================+=============+=====+=======+===========+===========+==========+===================+
| default     | 11.0.0.4          | bgpgroup-   | SB  | 65000 | establish | 3d:5h:47m | evpn     | [5/5/1]           |
|             |                   | ibgp-       |     |       | ed        | :9s       |          |                   |
|             |                   | rrclient-   |     |       |           |           |          |                   |
|             |                   | my-fabric   |     |       |           |           |          |                   |
| default     | 11.0.0.5          | bgpgroup-   | SB  | 65000 | establish | 3d:5h:47m | evpn     | [5/0/1]           |
|             |                   | ibgp-       |     |       | ed        | :9s       |          |                   |
|             |                   | rrclient-   |     |       |           |           |          |                   |
|             |                   | my-fabric   |     |       |           |           |          |                   |
| default     | fe80::1844:bff:fe | bgpgroup-   | DB  | 100   | establish | 3d:5h:47m | ipv4-    | [5/5/6]           |
|             | ff:1%ethernet-    | ebgp-my-    |     |       | ed        | :15s      | unicast  | [0/0/0]           |
|             | 1/31.0            | fabric      |     |       |           |           | ipv6-    |                   |
|             |                   |             |     |       |           |           | unicast  |                   |
| default     | fe80::1856:cff:fe | bgpgroup-   | DB  | 100   | establish | 3d:5h:47m | ipv4-    | [5/5/2]           |
|             | ff:1%ethernet-    | ebgp-my-    |     |       | ed        | :14s      | unicast  | [0/0/0]           |
|             | 1/32.0            | fabric      |     |       |           |           | ipv6-    |                   |
|             |                   |             |     |       |           |           | unicast  |                   |
+-------------+-------------------+-------------+-----+-------+-----------+-----------+----------+-------------------+
-----------------------------------------------------------------------------------------------------------------------
Summary:
2 configured neighbors, 2 configured sessions are established, 0 disabled peers
2 dynamic peers
EDA Dashboards
As you know show commands display state information in a human readable manner. Similarly, in EDA, network-wide state information can be used to create and populate dashboards, as we saw in Fabric summary dashboard.
1.3.3.3.4 Operational commands#
SR Linux' CLI also has some operational command. For example, you can use ping to validate the route-table and check connectivity.
Using network instance default
PING 11.0.0.2 (11.0.0.2) 56(84) bytes of data.
64 bytes from 11.0.0.2: icmp_seq=1 ttl=63 time=3.29 ms
64 bytes from 11.0.0.2: icmp_seq=2 ttl=63 time=3.40 ms
64 bytes from 11.0.0.2: icmp_seq=3 ttl=63 time=3.05 ms
64 bytes from 11.0.0.2: icmp_seq=4 ttl=63 time=3.52 ms
^CCommand execution aborted : 'ping 11.0.0.2 network-instance default '
EDA Workflows
The same can be done using EDA workflows as we saw in Using EDA Workflows.
1.3.3.4 Third party tools#
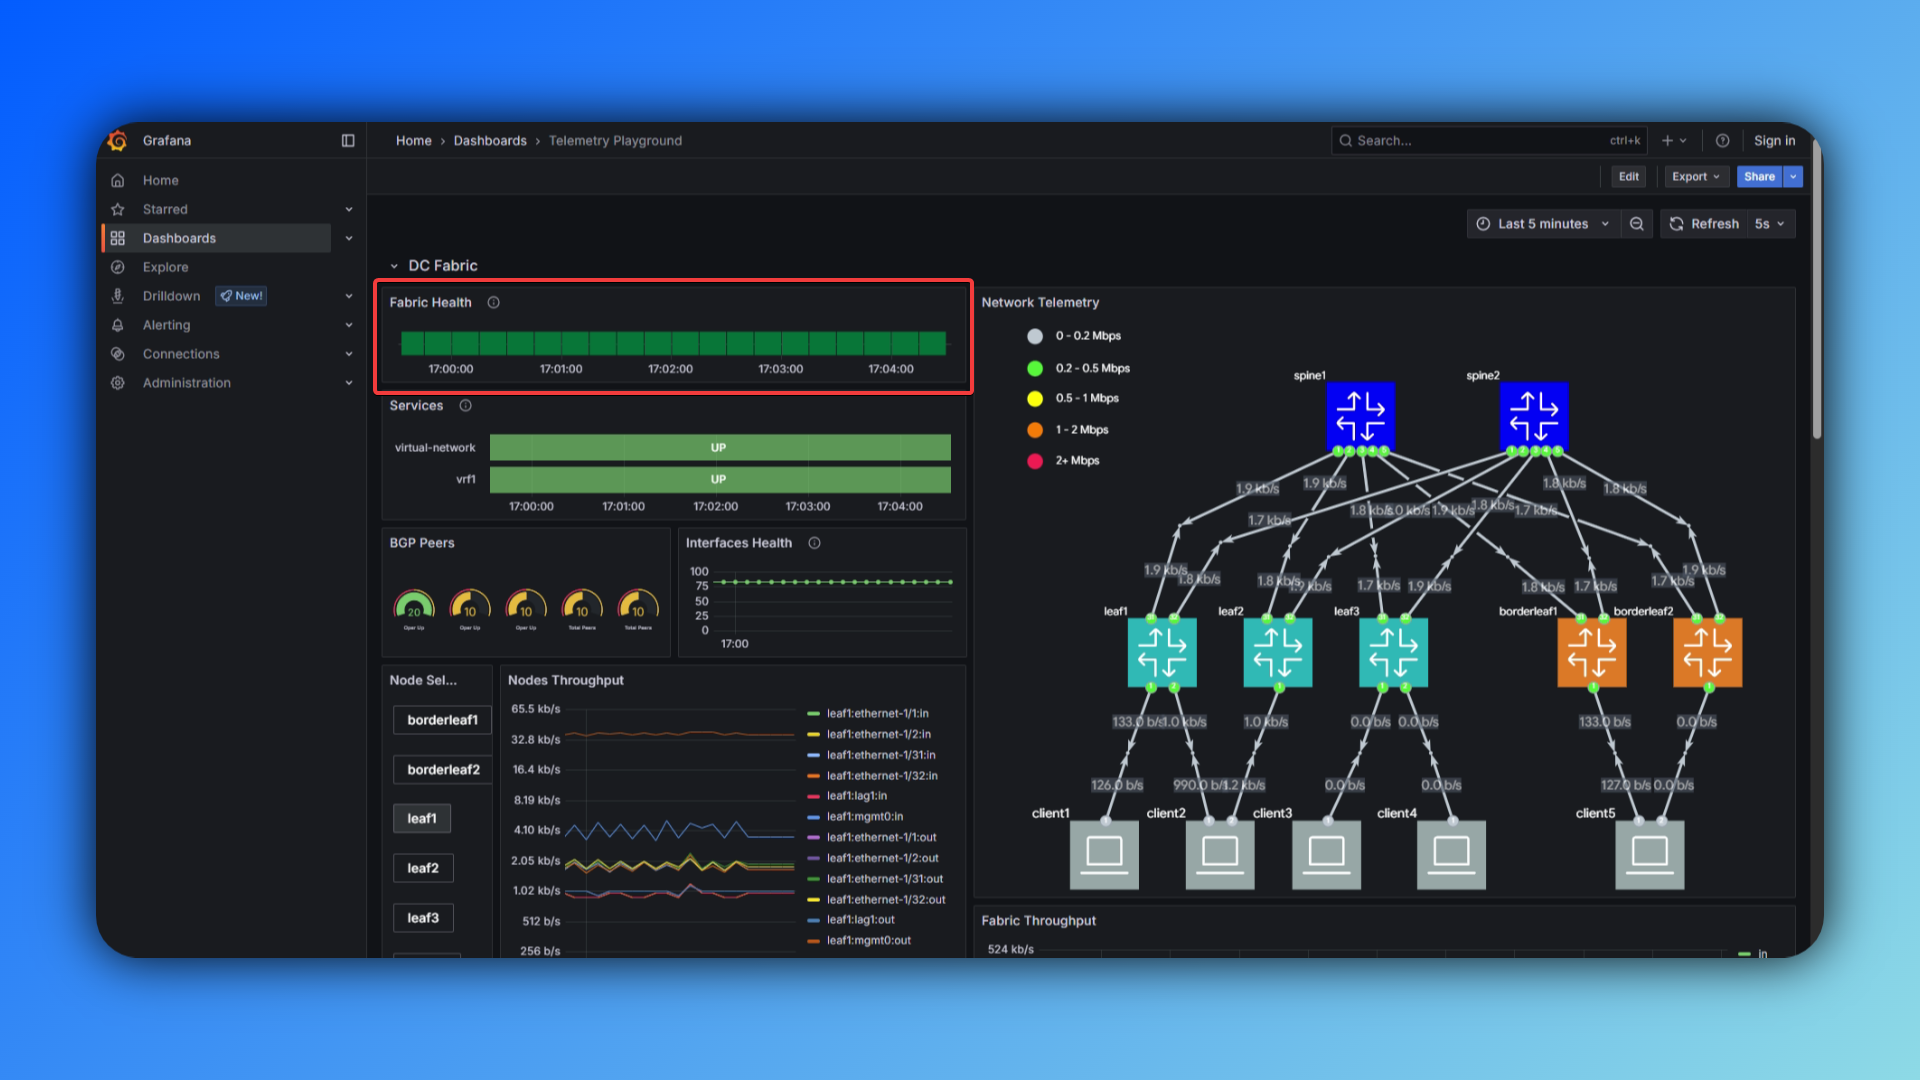
EDA's database is populated with a lot of useful metrics. All of these metrics can be exported and consumed by third party tools. For example, you can set up a telemetry stack using EDA's Prometheus exporter, which will export selected metrics into a Prometheus time series database. These metrics can then be visualized in a Grafana dashboard.
For this hackathon, a Grafana dashboard was created beforehand, that showcases a couple of useful metrics, such as fabric health, BGP peers, interface throughput, and so on.
The dashboard is available at: https://{your-ip}:9443/core/httpproxy/v1/grafana/dashboard
You can inspect the Prometheus time series database at: https://{your-ip}:9443/core/httpproxy/v1/prometheus/query
1.4 Summary#
In this exercise, you successfully created the underlay network in your Data Center Fabric, enabling connectivity between the different nodes.
- You created a Fabric resource which automatically triggered the creation of all components required to build your underlay connectivity.
- You validated the Fabric's deployment using Dashboards, EQL, Workflows, SR Linux CLI and a Grafana dashboard.
This exercise demonstrated the automation power of EDA when deploying Day 0 networks. It showcased the observability in EDA, and the ability to perform operational tasks.